
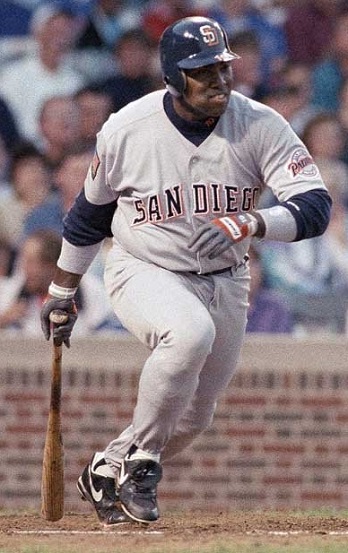
Hall of Famer Tony Gwynn hitting in Wrigley Field during 1994 . . .
Baseball fans love anniversaries as much as anything else about or around the game. This year’s a good one for those, and I’ve written about a couple of them already this year: the 1919 Reds (yes, they were a World Series winner but yes, they were robbed) centenary, and the 1969 Mets’ golden anniversary.
It’s also the 80th anniversary season of the day Lou Gehrig took himself out of the Yankee lineup to stay. And, the 30th anniversary of the season in which Pete Rose got banished for violating Rule 21(d), alas.
It’s also the quarter century of Hall of Famer Tony Gwynn’s chase to become baseball’s first .400 hitter since his old friend and fellow Hall of Famer Ted Williams. He almost made it, too. Six points short. Closer than fellow Hall of Famer George Brett got in 1980, when Brett came up short by ten.
The 1994 owners’ strike (call it what it really was: the owners pushed for and got that players’ strike no matter what you’ve read otherwise) cut Gwynn off at the pass. And it was both more and less than you thought while he was doing it.
More because you’ve got to have some kind of self discipline to hit that often, and Gwynn did lead the National League with his .394 final batting average and his .454 on-base percentage. (It was the only time he ever led the league in on-base percentage.) Less because it didn’t do as much to put or help runs onto the scoreboard as you’d think a near-.400 hitter reaching base that often will do.
The 1994 Padres were fourth in the National League West with a 47-70 record when the strike ended the season. They were outscored 531-479, a -52 run differential. Their only winning month was August, and they were 6-4 when the strike began. If you consider elementary run production as the sum of the runs you score and the runs you drive in, Gwynn produced 143 runs, which accounted for 27 percent of the Padres’ run production that season.
That he was only seven RBIs above the major league average for batters with 475 plate appearances should tell you how good that year’s Padres weren’t at reaching base ahead of him. He had a total of 306 baserunners when he batted and drove in 20 percent of those. And his extra base hit percentage (29) was only about four points above his career average (25).
If you consider my concept of real batting average—total bases + walks + intentional walks + sacrifices divided by plate appearances—this was Tony Gwynn in 1994. We’ll compare his 1994 first to George Brett’s 1980. In parentheses are their final season’s traditional batting averages, which (here we go again) should really be called hitting averages. Sorry, purists, but (here we go again again) something that treats all hits equal when all hits are not equal, and divides that number by official at-bats only, without accounting for everything a man does at the plate, is a batter’s incomplete story.
| Player | PA | TB | BB | IBB | Sacs | RBA | XBH% |
| Tony Gwynn (.394) | 475 | 238 | 48 | 16 | 6 | .648 | 29 |
| George Brett (.390) | 515 | 298 | 58 | 16 | 7 | .736 | 38 |
Gwynn’s 1994 RBA is 122 points above his career number. And, his career number is the lowest among all nine post-World War II/post-integration/night ball era Hall of Fame right fielders and 51 points below the average RBA for those Hall of Fame right fielders. Chasing a .400 hitting average, Gwynn in 1994 batted well over his own formidable head. It’s a shame that Gwynn’s team hurt him as much as he helped them, and the 1994 Padres—talking strictly about their non-pitchers—batted .283 with a .330 on-base percentage as a team.
The 1994 metrics say the Padres would have scored ten runs a game if they could have had nine Tony Gwynns in the lineup. Gwynn created (as opposed to produced) 104 runs that season and used a sliver less than three outs a run to do it, which is splendid run creation for a high-average hitter with minimal power in an abbreviated season. He was still likely to finish well over his lifetime head if the season had played all the way: lifetime per 162 games, Gwynn created 109 runs and used 4.1 outs to do it.
Brett played a little over his own head in 1980, too. His RBA is 176 points above his career number, and he played a far more demanding field position, as he did for the majority of his career. Brett’s career RBA is just two points below the average RBA among seven Hall of Fame third basemen of the same era, and fourth behind, in ascending order, Eddie Mathews, Chipper Jones, and Mike Schmidt. The 1980 Royals (who also won the pennant that year) would have scored twelve runs a game if they could have had nine George Bretts in the lineup. Brett created 134 runs and used 2.2 outs to do it in 1980; lifetime, his 162-game average is 112 runs created using 4.1 outs to do it.
There are several post-World War II/post-integration/night ball era .300 hitters in the Hall of Fame who used more outs per run created in their careers; there are several who used fewer. Here’s a look, including their extra-base hit percentages, also including a player who would be in the Hall of Fame if not for, you know, the other stuff:
| Player | RC/162 | Outs/162 | Outs/RC (162) | XBH% |
| Ted Williams | 169 | 374 | 2.2 | 42 |
| Stan Musial | 137 | 415 | 3.0 | 38 |
| Edgar Martinez | 129 | 416 | 3.2 | 37 |
| Chipper Jones | 127 | 432 | 3.4 | 39 |
| Willie Mays | 128 | 436 | 3.4 | 40 |
| Frank Thomas | 140 | 426 | 3.4 | 42 |
| Mike Piazza | 117 | 430 | 3.7 | 37 |
| Henry Aaron | 123 | 449 | 3.7 | 39 |
| Vladimir Guerrero | 123 | 453 | 3.7 | 38 |
| Wade Boggs | 116 | 436 | 3.8 | 25 |
| George Brett | 112 | 459 | 4.1 | 35 |
| Tony Gwynn | 109 | 442 | 4.1 | 25 |
| Kirby Puckett | 109 | 480 | 4.4 | 29 |
| Roberto Clemente | 104 | 458 | 4.4 | 28 |
| Pete Rose | 101 | 470 | 4.7 | 24 |
Nice company to be in if you can get it.
But was Tony Gwynn the best man at the plate in the National League in 1994? Let’s look at the RBAs and extra-base hit percentages of the top ten hitting average finishers that season, in descending order. (Sorry, I’m staying with the program. Their hitting averages are in parentheses.)
| Player | PA | TB | BB | IBB | Sacs | RBA | XBH% |
| Tony Gwynn (.394) | 475 | 238 | 48 | 16 | 6 | .648 | 29 |
| Jeff Bagwell (.368) | 479 | 300 | 79 | 12 | 10 | .837 | 50 |
| Mike Kingery (.349) | 301 | 160 | 30 | 2 | 13 | .681 | 34 |
| Moises Alou (.339) | 471 | 250 | 42 | 10 | 5 | .651 | 41 |
| Hal Morris (.335) | 483 | 214 | 34 | 8 | 8 | .547 | 30 |
| Kevin Mitchell (.326) | 380 | 211 | 59 | 15 | 8 | .771 | 49 |
| Gregg Jefferies (.325) | 447 | 194 | 45 | 12 | 4 | .570 | 31 |
| Larry Walker (.322) | 452 | 230 | 47 | 5 | 6 | .637 | 51 |
| Bret Boone (.320) | 424 | 187 | 24 | 1 | 11 | .526 | 32 |
| Bip Roberts (.320) | 449 | 110 | 17 | 1 | 1 | .287 | 18 |
You are now free to stop rubbing your eyes. (As I had to after calculating Bip Roberts, even running it three times to be absolutely sure I wasn’t seeing things. You’ve heard of the empty .300 average? The Sahara Desert isn’t that parched.) You’re also free to admit that you didn’t remember Mike Kingery and Hal Morris as quickly as you might have remembered Moises Alou, Kevin Mitchell, Gregg Jefferies, Larry Walker, and Bret Boone.
Gwynn’s fellow Hall of Famer Jeff Bagwell led the league in extra-base hits, slugging percentage, OPS, offensive winning percentage, win probability added, and times on base, with only four more plate appearances than Gwynn. Bagwell’s hitting average was 26 points lower than Gwynn’s chartbuster, but his RBA is a glandular 189 points higher.
Marry that to Bagwell’s having to put up with the Astrodome as his home park and I’m pretty sure that RBA is glaring enough without throwing in that his 51 percent extra-base hits is just a little more impressive than Larry Walker’s 51. (I bet you forgot the old wreck known as Olympic Stadium was a pretty fair hitter’s park, though nothing like the one Walker would get to play in in Colorado.)
Gwynn’s home park, still known then as Jack Murphy Stadium, was more neutral. He ended up tenth in slugging percentage, fourth in OPS and offensive winning percentage, sixth in win probability added, and second in times on base. That ain’t peanuts and Cracker Jack. But Bagwell also led the National League with 137 runs created and he used one fewer out to do it than Gwynn used creating 104 runs that season.
And if you want to look at the more team-dependent runs produced, adding runs scored and runs batted in, Gwynn was good for 166 . . . but Bagwell (who led the league in runs scored and the Show in runs batted in) was good for 220. You know how often writers and broadcasters love to grind away at if the season ended right now during the second half of any season? Try to imagine how far off the charts Bagwell would have been if the 1994 season went the distance after all.
MLB.com’s A.J. Cassavelli commemorates Gwynn’s cleanest shot at hitting .400 with a nicely rounded analysis suggesting he might have gone all the way there if the strike hadn’t hit. The way he was in 1994, Gwynn might well have gotten to or even a little bit past his career 162-game average of 92 runs scored and 76 runs batted in, too. And it still would have meant at least 52 runs short of Bagwell’s 1994 deliverance.
It’s not Gwynn’s fault that his team wasn’t as good as Bagwell’s. If you put Gwynn on Bagwell’s team, even in the Astrodome, Gwynn might have done a little better: he hit .357 lifetime in 107 games in the World’s Biggest Hair Dryer (thank you, Joe Pepitone), and his RBA there is only four points below his lifetime RBA. Now, change his uniform to the Astros’ fatigues. With a couple of better table setters ahead of him and a couple of more consistent run deliverers behind him.
Everyone admired Gwynn’s craftsmanship in 1994 especially, when he had a better than moderate shot at meeting his friend Ted Williams in the .400 club, just as they admired it in George Brett in 1980. Gwynn just might have joined the club, especially as torrid as he started in August before the strike began. If the only thing you saw was his traditional batting average, his hitting average, you’d have thought he was the man at the plate that year.
But when I look at him without team-dependent factors at play, I conclude that yes, he was off even his own charts as a great player in 1994, though it was actually the fifth-best season of his career. He had a no-questions-asked Hall of Fame career, but thanks to the strike we’ll never really know whether he’d have moved past the four seasons that were better than ’94 for him.
In 1994’s National League you had to like your chances a lot more with Jeff Bagwell at the plate. The Most Valuable Player Award voters certainly did. Bagwell won the 1994 award overwhelmingly, with 392 votes total and all 28 first-place votes. Come to think of it, you’d have liked your chances a lot more with Bagwell that season, too. Both men were almost equal for scoring after reaching base (Bagwell: 35 percent; Gwynn: 33 percent), but Bagwell was almost twice as likely to take the extra base on a followup hit than Gwynn. (Bagwell’s extra base taken percentage was 61 percent—for perspective, Hall of Famer Willie Mays’s lifetime percentage is 60 percent—and Gwynn’s was 35 percent.)
And I didn’t even have to think about wins above replacement-level player (WAR) until now. Keep in mind Baseball Reference‘s conjugation: 8.0 or better is MVP caliber; 5.0 or better, All-Star caliber; 2.0 or better, good enough to be a regular starter; 0.0-2.0, reserve; -0.0, replacement level, and you’re likely to be replaced. So here it is for the 1994 National League: Only Hall of Fame pitcher Greg Maddux did better than Jeff Bagwell, 8.7 (Maddux) to 8.2 (Bagwell). Only one other NL player (Barry Bonds) earned 6.0 WAR or better in ’94. Gwynn earned 4.2 WAR, closer to All-Star level than just being another guy in the starting lineup.
God rest Mr. Padre’s soul in peace. I hope he and his old homeboy/friend/teacher Teddy Ballgame keep bending everyone else’s ears off about the art and science of hitting, even if Yogi Berra sidles up to them with the bad-ball hitter’s perspective insisting you can’t think and hit at the same time.
Getting within a hair’s breadth of .400 made Tony Gwynn better than his own team and invaluable copy aside from the pending strike. But it didn’t mean he was the National League’s best or most complete hitter that year.
As I write, Cody Bellinger of the Dodgers is hitting .404. He leads the Show in on-base percentage (.481), slugging percentage (.788), OPS (1.270), total bases (123), and hits (63). His team’s quality around him also has him leading in runs scored (41) and runs batted in (42). Would you like to see how he really looks with all that?
| PA | TB | BB | IBB | Sacs | RBA | XBH% | |
| Cody Bellinger (.404) | 185 | 123 | 25 | 4 | 3 | .837 | 43 |
If he sustains it (it’s probably a very big “if”), and with no strike threatening to shorten the season, Bellinger could yet generate two things from 1994: Tony Gwynn’s copy, and Jeff Bagwell’s value. Neither would be unbecoming.
